
Austin Real Estate Market Report March 2016
The statistics below show an accurate picture of how the Austin-area housing market stands. These statistics are for single-family homes compared year-over-year. Visit ABoR.com/statsmar16 for the full press release and other area-specific infographics.
Austin Real Estate Market Report March 2016
- 2,552 – Single-family homes sold, 9.3 percent more than March 2015.
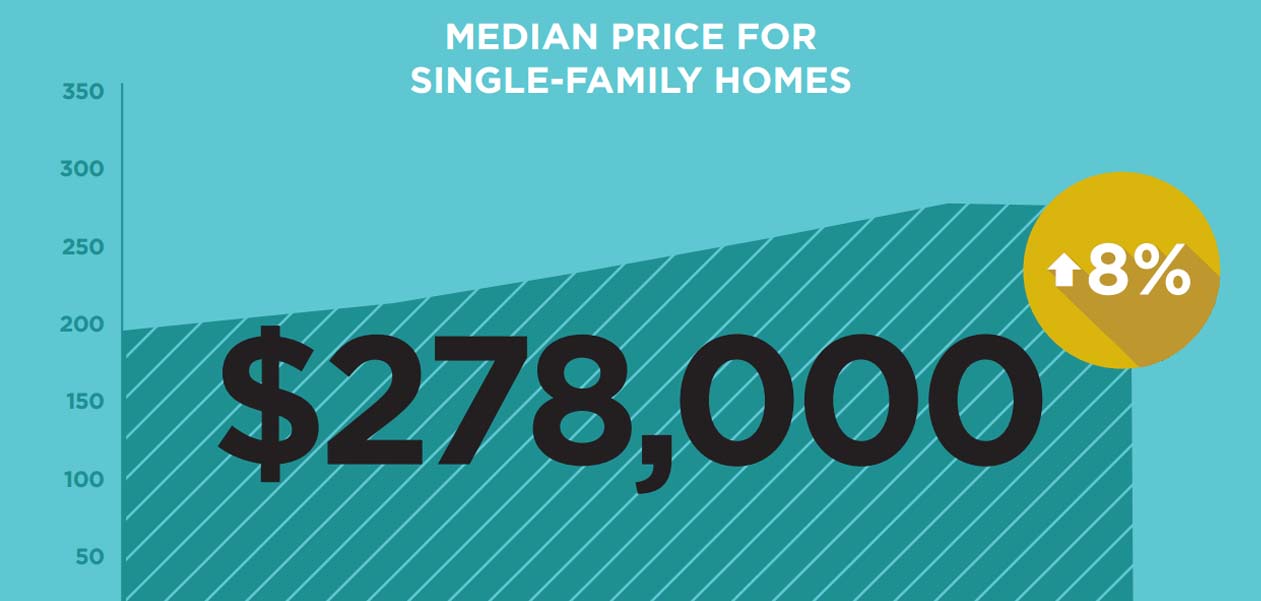
- $278,000 – Median price for single-family homes, 7.8 percent more than March 2015.
- $347,734 – Average price for single-family homes, 4.5 percent more than March 2015.
- 54 – Average number of days single-family homes spent on the market, unchanged compared to March 2015.
- 3,633 – New single-family home listings on the market, 12.2 percent more than March 2015.
- 4,669 – Active single-family home listings on the market, 1.5 percent more than March 2015.
- 2,811 – Pending sales for single-family homes, 7.2 percent more than March 2015.
- 2.0 – Months of inventory* of single-family homes, 0.2 months less than March 2015.
- $887,419,074 – Total dollar volume of single-family properties sold, 14.1 percent more than March 2015.

Austin Real Estate Market Report March 2016
The Austin Board of REALTORS® (ABoR) builds connections through the use of technology, education and advocacy to strengthen the careers of its 11,000 members and improve the lives of Central Texas families. We empower Austin REALTORS® to connect their clients to the region’s most complete, accurate and up-to-date listings data. For more, contact the ABoR Department of Public Affairs at marketing@abor.com or 512-454-7636. For the latest local housing market listings, visit AustinHomeSearch.com.
* The inventory of homes for a market can be measured in months, which is defined as the number of active listings divided by the average sales per month of the prior 12 months. The Real Estate Center at Texas A&M University cites that 6.5 months of inventory represents a market in which supply and demand for homes is balanced.
Austin Real Estate Market Infographic March 2016

Austin Real Estate Market Infographic March 2016